
This article is part of the 7-part Testing LangGraph Applications series. The examples come from the langgraph-testing-demo repository.
Testing LangGraph Applications Series
- Stop Testing AI Outputs. Start Testing State
- How to Structure LangGraph Tests That Actually Scale
- Testing Isn’t Enough: Evaluating LangGraph Workflows That Actually Work
- Testing Parallel LangGraph Workflows Without Losing Control
- Understanding LangGraph Workflows with LangSmith Traces and pytest ← You are here
- Command vs Send in LangGraph: Choosing the Right Primitive
- What It Takes to Build Production-Ready LangGraph Systems
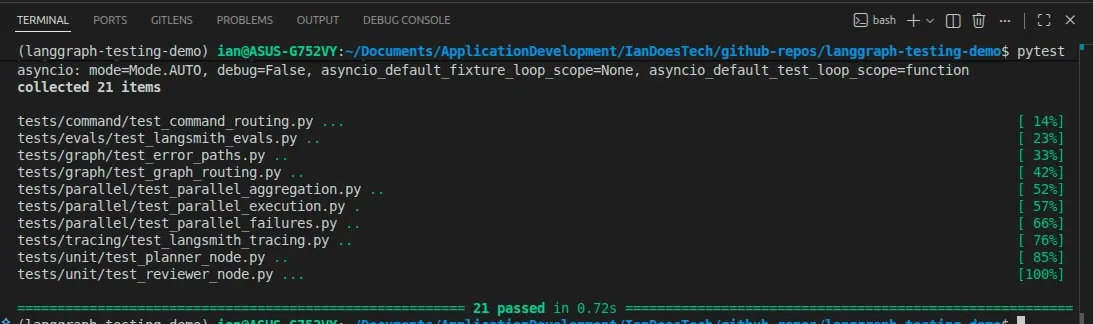
All examples in this article are backed by pytest-based tracing tests that generate LangSmith traces for both linear and parallel workflows:
So far in this series, we’ve looked at:
- testing LangGraph workflows as state machines
- structuring pytest suites
- evaluating outputs with datasets
- testing parallel branches and aggregation
That gives us confidence before we ship, but it doesn’t tell us everything.
Once a workflow’s running, we also need to understand what actually happened inside a specific run. That’s where tracing becomes important.
Testing Is Not Observability
Tests answer questions like:
- Did the graph route correctly?
- Did retries happen?
- Did failures stop execution?
- Did the output meet a minimum quality bar?
Those are essential questions, but they’re not the same as runtime observability.
When something unexpected happens, you need to know:
- Which nodes ran?
- What state did they receive?
- What did they return?
- Where did the workflow branch?
- What happened inside a parallel run?
Tracing provides a way to inspect those details without guessing from logs or final outputs alone.
LangSmith Already Understands LangGraph
A common instinct is to start adding logging statements everywhere.
That can help in some systems, but with LangGraph and LangSmith, it doesn’t usually need to be your first move, as LangSmith already integrates naturally with LangGraph workflows.
So in many cases, simply enabling tracing is enough to start visualizing:
- graph execution
- node ordering
- parallel branches
- retries
- aggregation
- state movement
That means you can keep your workflow code focused on:
- state
- routing
- orchestration
- evaluation
- business logic
instead of turning every node into a logging wrapper.
Enabling LangSmith Tracing
For this demo repo, tracing is enabled with environment variables:
export LANGSMITH_TRACING=true
export LANGSMITH_API_KEY=your_api_key
Once configured, each LangGraph run automatically produces traces in LangSmith.
That gives you observability without changing the graph architecture itself.
pytest as a Tracing Harness
The repository includes a dedicated tracing module:
tests/tracing/test_langsmith_tracing.pyUnlike a normal unit test, these tests aren’t focused on validating detailed business logic.
Instead, they serve as repeatable tracing smoke tests that:
- execute the workflows
- generate LangSmith traces
- log structured test metadata
- confirm the runs completed successfully
The module uses the LangSmith pytest integration directly:
import pytest
from langsmith import testing as t
and marks each tracing test with:
@pytest.mark.langsmithThe @pytest.mark.langsmith marker does more than generate traces. It also creates LangSmith experiment rows tied directly to pytest cases.
Skipping Cleanly When LangSmith Is Not Configured
The tests skip automatically when LangSmith credentials are unavailable:
def _langsmith_disabled() -> bool:
    return not os.getenv("LANGSMITH_API_KEY")
This allows developers to run the full pytest suite locally without requiring LangSmith access:
pytestThe tracing tests are skipped rather than failing.
Tracing the Linear Workflow
The first tracing test runs the original linear graph:
@pytest.mark.langsmith
@pytest.mark.asyncio
async def test_linear_graph_traces_when_enabled() -> None:
The test logs structured inputs:
t.log_inputs({"user_input": user_input})reference outputs:
t.log_reference_outputs({"review_status": "approved"})and final outputs:
t.log_outputs(
    {
        "review_status": result.get("review_status"),
        "final_output": result.get("final_output"),
    }
)
The graph itself is invoked with LangSmith metadata attached:
result = await graph.ainvoke(
    {"user_input": user_input},
    config={
        "metadata": {
            "demo": "linear-tracing",
            "test_type": "observability",
        }
    },
)
Finally, the test records structured feedback:
t.log_feedback(
    key="approved",
    score=result.get("review_status") == "approved",
)
and confirms the workflow completed successfully:
assert result["review_status"] == "approved"
assert "final_output" in result
Tracing the Parallel Workflow
The second tracing test targets the parallel graph:
@pytest.mark.langsmith
@pytest.mark.asyncio
async def test_parallel_graph_traces_when_enabled() -> None:
This workflow is much more interesting from an observability perspective because it includes:
- planner routing
- multiple researcher branches
- aggregation
- review
- synthesis
The test records expectations about the workflow:
t.log_reference_outputs(
    {
        "review_status": "approved",
        "research_result_count": 3,
    }
)
Then it logs the final outputs and aggregation result:
t.log_outputs(
    {
        "review_status": result.get("review_status"),
        "research_result_count": research_result_count,
        "aggregate_research": result.get("aggregate_research"),
        "final_output": result.get("final_output"),
    }
)
The test also records custom feedback:
t.log_feedback(
    key="expected_parallel_branches",
    score=research_result_count == 3,
)
This allows the LangSmith experiment dashboard to track workflow-specific metrics beyond simple pass/fail results.
What the LangSmith Results Look Like
Running the tracing suite now produces a dedicated LangSmith experiment tied directly to the pytest module.
In this example, LangSmith records:
- pass/fail status
- custom feedback metrics
- latency metrics
- trace metadata
- experiment runs
- graph execution traces
Here’s the resulting experiment dashboard:
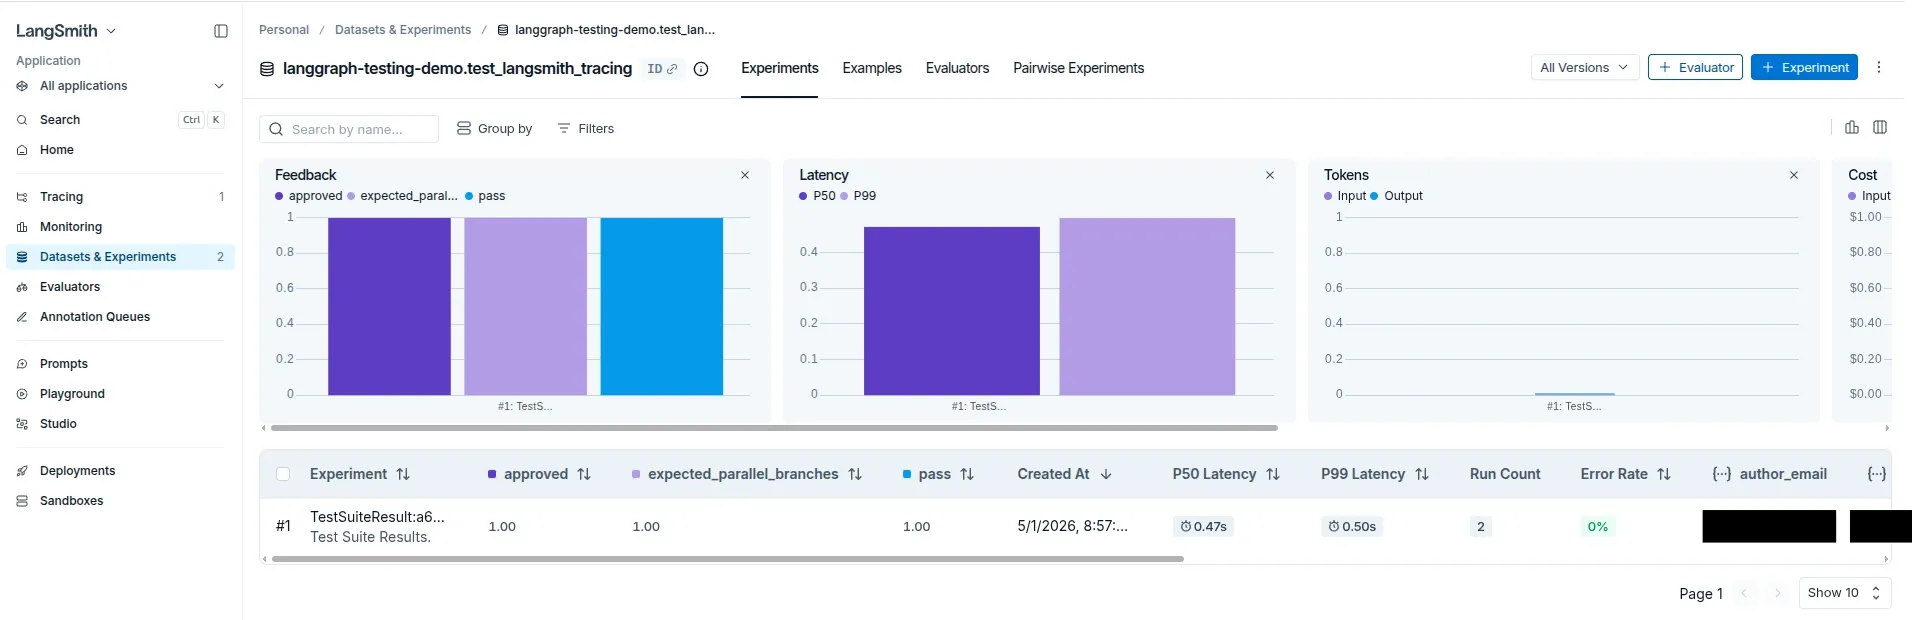
Notice the custom feedback columns:
approvedexpected_parallel_branchespass
Those values come directly from the pytest integration and t.log_feedback(...) calls inside the tracing tests.
The tests are no longer just generating raw traces. They’re producing structured experiment results that LangSmith can aggregate and compare over time.
Why Metadata Matters
Both tracing tests attach metadata during graph execution:
config={
    "metadata": {
        "demo": "parallel-tracing",
        "test_type": "observability",
    }
}
This becomes useful once a project has multiple environments, test types, and debugging workflows.
Metadata allows you to distinguish:
- tracing runs
- evaluation runs
- staging experiments
- local debugging sessions
- CI test executions
without changing the graph itself.
Good Traces Start with Good Graph Design
Turning on LangSmith is only part of the work.
The trace is much easier to use when the graph is designed so its execution path tells a clear story.
That means using:
- clear node names
- explicit routing
- structured state
- deterministic aggregation
- meaningful field names
In this repo, fields such as these make traces much easier to understand:
review_status
research_results
branch_errors
aggregate_research
final_output- If a branch fails,
branch_errorsreveals what happened. - If aggregation behaves unexpectedly,
aggregate_researchbecomes inspectable. - If review fails,
review_statusexplains why execution stopped.
Observability quality depends heavily on workflow design quality.
Tracing vs Testing vs Evaluation
At this point, the repo now demonstrates three different feedback loops.
Testing
Testing asks:
Did the system behave correctly?
Examples:
- unit tests
- graph routing tests
- failure-path tests
Evaluation
Evaluation asks:
Was the output good enough?
Examples:
- dataset evaluations
- completeness scores
- quality thresholds
Tracing
Tracing asks:
What happened during this specific run?
Examples:
- which nodes executed
- what state moved through the graph
- where branching occurred
- what metadata was attached
- how parallel workers behaved
In practice, you’ll likely need all three because they solve different problems.
Running the Tracing Tests
With LangSmith configured:
export LANGSMITH_TRACING=true
export LANGSMITH_API_KEY=your_api_key

pytest tests/tracing/test_langsmith_tracing.py --langsmith-output
Without LangSmith configured, the tests skip cleanly. That keeps tracing optional during local development while still making observability available when needed.
Why the Graph Design Still Matters
Observability isn’t about producing more logs. It’s about making workflow behavior understandable.
LangGraph already provides strong foundations for that because it encourages:
- explicit nodes
- explicit state
- explicit routing
LangSmith builds on top of those strengths by visualizing how a run actually executed.
But the design still matters.
Clean graph design produces useful traces.
What’s Next
At this point, the repo demonstrates:
- deterministic testing
- graph-level behavior tests
- failure-path tests
- dataset-based evaluation
- parallel branch testing
- LangSmith tracing and experiment integration
And now, another design question rears its head:
When should you use
Send, and when should you useCommand?
That distinction starts to matter a lot more once workflows become more complex.
Final Thought
You don’t need to turn every node into a logging project.
Start with built-in LangSmith tracing and use pytest as a structured execution harness. Then design the graph in a way that makes traces easy to follow.