

An executive dashboard shows that late deliveries have increased. Someone selects a region, drills into a product group, and asks why the result differs from last month’s operational report.
Late delivery is the example, not the architectural boundary. A disputed claim total, an arrears measure, a patient-waiting-time result, or a support-service metric would pass through the same kinds of responsibilities.
The dashboard is only the visible end of that question. Answering it may depend on data extracted from several applications, retained at particular points in time, matched across inconsistent identifiers, tested, reshaped into an analytical model, and exposed through agreed calculations.
When those responsibilities are hidden inside one large pipeline or report, a simple disagreement can become difficult to investigate:
 Did every source deliver the expected records?
- Which version of a corrected order was used?
- Where were customer and product identifiers matched?
- Was the late-delivery rule applied consistently?
- Did the semantic model refresh after the warehouse load?
- Can the published result be reproduced?
The layers of a data warehouse help make those questions answerable. They separate different kinds of work so that data can move from operational use to analytical use without losing its meaning, history, or accountability along the way.
Layers Describe Responsibilities
A diagram of a warehouse often looks like a row of boxes: sources, ingestion, staging, transformation, warehouse, semantic model, and reports. That can give the impression that every box must be a separate product or storage location.
It doesn’t.
A logical layer describes a responsibility and a boundary. Depending on the scale and platform, several layers may exist within one service or database. A large organisation might use several technologies within a single layer.
For example, ingestion may include scheduled extracts, change data capture, file transfers, and event streams. Those mechanisms perform related work, but they don’t have to run through one tool. Equally, a warehouse database may contain separate schemas for retained source data, transformation work, and curated dimensional models.
The following six responsibilities provide a practical way to examine the path from sources to decisions:
- 1Source boundary
Understand what each operational system records and how it may be accessed safely.
- 2Ingestion and landing
Capture data reliably and retain enough evidence to validate or replay the movement.
- 3Preparation and integration
Clean, standardise, match, derive, and reconcile data across sources.
- 4Curated warehouse
Organise trustworthy historical data for analytical questions and efficient use.
- 5Presentation or semantic layer
Expose relationships, measures, hierarchies, terminology, and access behaviour.
- 6Consumption
Support reports, analysis, applications, extracts, data science, and decisions.
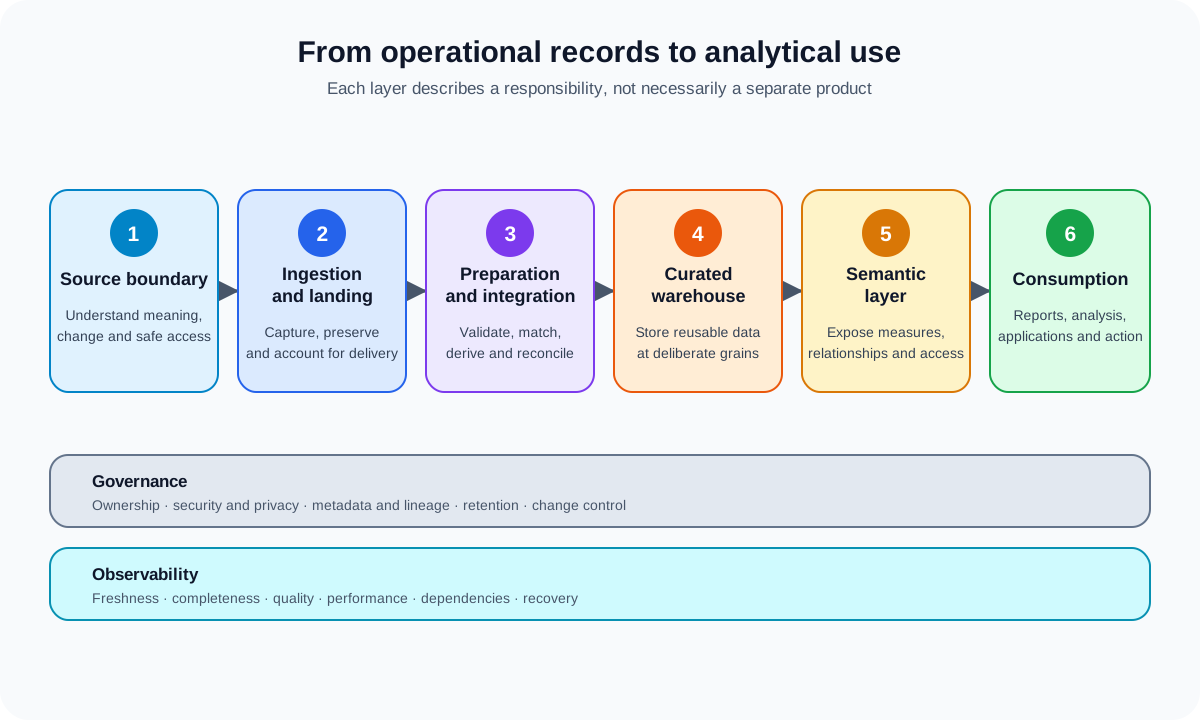
Logical responsibilities connect source data to analytical use, with governance and observability applying across the complete path.
1. The Source Boundary
Operational applications are designed to run business processes. A sales system records orders. A finance system posts transactions. A support platform manages cases. Their structures, controls, and change patterns reflect those operational responsibilities.
The source boundary establishes what the analytical platform can obtain without treating the source as if it were designed for warehouse use.
Useful source assessment covers more than table names:
| Concern | What the warehouse team needs to understand |
|---|---|
| Meaning | What records, statuses, timestamps, and codes mean in the operational process |
| Change | Whether records are inserted, updated, deleted, corrected, or overwritten |
| Access | Which supported interfaces exist and how extraction affects the source |
| Timing | When data becomes available and when a business event is considered complete |
| Control | Who owns the source, approves access, and communicates change |
| Limitations | Which requested events, relationships, or historical states aren’t captured reliably |
This is also where teams discover that the same-looking field can have different meanings. An order date might mean creation, confirmation, invoicing, or posting, depending on the system and report.
Direct reporting against a source may be reasonable for a narrow operational need. It becomes less attractive when analysis combines several systems, needs retained history, applies shared definitions, or creates workloads that compete with operational users.
2. Ingestion and Landing
The first responsibility is to capture the required source data dependably without disrupting the operational service. The process needs to know what it expected, what arrived, when it arrived, and whether it can safely continue or retry. Data engineers call this ingestion.
The mechanism might be a scheduled extract, a delivered file, a feed of changes, a stream of events, or a connection that leaves some data in place. The choice matters less here than the evidence and recovery behaviour.
A landing area or staging area commonly retains data near its source representation before substantial business transformation. This can provide several benefits:
 Avoid repeatedly extracting the same data from an operational system.
- Compare what arrived with source counts, files, or control totals.
- Investigate a failed transformation using the original delivered data.
- Replay downstream processing without asking the source to resend everything.
- Separate source availability from later transformation and reporting schedules.
Near-source doesn’t mean undocumented or uncontrolled. Retained data still needs an owner, access restrictions, retention rules, metadata, and protection appropriate to its sensitivity.
Nor is staging universally required. A small repeatable load may transform data safely in one operation. Virtualisation or replication may reduce the need for a conventional landing database. Staging earns its place when it improves reliability, recovery, source protection, or reuse enough to justify another managed copy.
The distinction between staging and a data lake is also useful. A staging area supports a data movement process and may be temporary. A data lake is a broader storage architecture that can retain structured, semi-structured, and unstructured data for several kinds of use. Article 8 examines that architectural choice in more detail.
3. Preparation and Integration
Raw delivery doesn’t create analytical consistency. Preparation and integration turn source-specific records into data that can be compared and used together.
The work may include:
 Standardise data types, units, time zones, codes, and formats.
- Validate mandatory fields, ranges, relationships, and business rules.
- Match customers, products, locations, or other entities across systems.
- Resolve duplicates and define how conflicting records are handled.
- Derive reusable measures, classifications, and business events.
- Apply history and correction rules deliberately.
- Quarantine or report records that can't be processed safely.
These aren’t merely technical clean-up tasks. Choosing which customer record survives a match, which currency rate applies, or whether a cancelled order contributes to demand is a business decision expressed through data logic.
That logic needs named ownership and testable outcomes. Otherwise, a transformation can run perfectly while implementing a definition nobody intended.
Article 6 examines ETL, ELT, orchestration, testing, and reconciliation in detail. At this point, the key architectural observation is that transformation has responsibilities of its own. Hiding all of them inside reports makes reuse, testing, and investigation more difficult.
4. The Curated Warehouse
The curated warehouse layer stores integrated analytical data in structures intended for repeated use. It provides a stable boundary between source-specific processing and the models supplied to consumers.
For a dimensional warehouse, this will often mean fact and dimension tables at declared grains. Other warehouse approaches may retain an integrated enterprise model and supply dimensional marts from it. The previous article discussed those different planning emphases.
The curated layer should make important choices visible:
- What business event or state does each row represent?
- Which measures can be added, averaged, counted, or compared?
- Which descriptive attributes are shared across business processes?
- How are late-arriving records and corrections handled?
- Which historical changes are retained?
- How can a published result be reconciled to its inputs?
This layer isn’t synonymous with every table inside a warehouse platform. Temporary work tables, landing schemas, audit logs, and semantic-model objects may coexist on the same technology while serving different responsibilities.
5. The Presentation or Semantic Layer
A report author shouldn’t have to learn warehouse table names or reconstruct business rules before producing a useful result. This layer presents readable names, relationships, agreed calculations, drill paths, formatting, and access behaviour over curated data.
This responsibility is commonly called a presentation layer or semantic layer. Modern Microsoft platforms use the term semantic model.
Readers may also encounter OLAP cube, multidimensional model, tabular model, presentation server, or business layer. These names come from different periods and products; understanding the shared responsibility is more important here than memorising them.
For example, the warehouse may store order and delivery dates, a reporting-calendar dimension, delivery status, and a reusable late-delivery indicator at the appropriate grain. The semantic layer can build on those structures by defining an agreed late-delivery rate, useful drill hierarchies, readable names, formatting, and role-specific access. Some responsibilities, particularly security, may be enforced at several layers.
Microsoft’s guidance on online analytical processing describes semantic models as the place where relationships, calculations, aggregation behaviour, and business-friendly structures can be exposed over warehouse data.
Not every calculation belongs in the warehouse, and not every calculation belongs in the semantic model. A reusable currency conversion needed by several downstream uses may belong earlier. A display-specific percentage or interactive calculation may fit naturally in the semantic layer. The choice depends on reuse, performance, auditability, change ownership, and the capabilities of the consuming tools.
6. Consumption and Decisions
Consumption is broader than dashboards. A curated analytical platform might support:
- Governed reports and scorecards
- Exploratory analysis and self-service BI
- Regulatory or contractual extracts
- Data supplied to applications and business workflows
- Statistical analysis and machine-learning features
- Alerts or actions triggered by analytical conditions
Different consumers may need different grains, freshness, interfaces, and controls. A monthly executive scorecard and a near-real-time exception workflow can use related data without having identical service expectations.
This is why consumption requirements belong near the start of planning. If the team doesn’t understand how the information will be used, it can’t sensibly choose refresh frequency, aggregation, security, recovery objectives, or performance targets.
The End-to-End View
The layers can now be read as a sequence of accountable responsibilities:
- Source boundary: Understand and safely access operational records.
- Ingestion and landing: Capture, preserve, and account for delivered data.
- Preparation and integration: Standardise, validate, match, derive, and reconcile it.
- Curated warehouse: Store reusable analytical data at deliberate grains with managed history.
- Presentation or semantic layer: Expose governed business meaning and analytical behaviour.
- Consumption: Deliver information through experiences suited to decisions and other uses.
This resembles the ingest, transform, model, and serve stages in Microsoft’s modern data warehouse guidance. The labels vary between architectures, but the underlying responsibilities remain recognisable.
Governance and Observability Aren’t Final Layers
Governance and observability are sometimes drawn as boxes at the end of an architecture. That position understates their role.
They need to cross the path:
| Responsibility | Examples across the layers |
|---|---|
| Ownership | Source owner, data steward, transformation owner, model owner, service owner |
| Security and privacy | Extraction credentials, restricted landing data, masking, warehouse permissions, row-level access |
| Metadata and lineage | Source definitions, schemas, transformation dependencies, model relationships, report usage |
| Quality and reconciliation | Delivery counts, validation rules, rejected records, warehouse balances, published-measure checks |
| Observability | Source delay, pipeline failure, unusual row counts, stale models, slow queries, failed reports |
| Recovery | Re-extraction, replay from retained data, correction loads, model refresh, consumer communication |
Security applied only to a dashboard doesn’t protect a broadly accessible staging table. Monitoring a pipeline’s success doesn’t prove that it received a complete source extract. Lineage that ends at the warehouse doesn’t explain which reports and decisions are affected by a change.
The article on operability later in this series will explore these concerns further. Here, they provide a useful test of whether the architecture describes a working service or only a movement of data.
Common Layering Mistakes
 Copying data through several zones without giving each copy a distinct purpose.
- Treating retained source data as trustworthy merely because it has been landed.
- Embedding shared definitions separately in every report.
- Allowing users to depend on temporary staging structures.
- Transforming away evidence needed to investigate or replay a load.
- Creating a semantic model that hides unresolved warehouse inconsistencies.
- Monitoring job completion without checking data completeness or freshness.
More layers don’t automatically create a better design. Every persisted copy adds storage, security, retention, lineage, and support responsibilities. Every abstraction can make investigation harder if its purpose isn’t clear.
A simpler path is often preferable when it still provides the required isolation, history, reuse, control, and recovery.
Questions for an Architecture Review
- What responsibility does each layer or persisted copy perform?
- Can a failed load be investigated and replayed without damaging the source?
- Where are cross-system identities and shared definitions resolved?
- Which layer owns each important business rule?
- How does the curated model preserve the required history and grain?
- What does the semantic layer add for its consumers?
- Can lineage trace a published measure back to its sources and transformations?
- How will the team detect incomplete, stale, or inconsistent data?
Those questions should produce more than an attractive architecture diagram. They should identify responsibilities, owners, controls, service expectations, and evidence that can later guide design and testing.
The next article moves inside the curated warehouse layer. It examines how a business process, declared grain, facts, and dimensions become an analytical model that reflects the questions people need to answer.