

A request to “build a sales fact table” sounds specific until the modelling questions begin.
Should one row represent an order, an order line, a shipment, an invoice line, or a daily product balance? Is revenue recorded when an order is placed, dispatched, invoiced, or paid? Can freight be summed by product if the source records it once per order?
This article uses order fulfilment as a continuing worked example so that the modelling decisions remain concrete. The method isn’t specific to sales or physical products: the same questions apply to claims, payments, subscriptions, service cases, clinical activity, and other measurable processes.
Those choices affect every report built on the model. If they remain implicit, technically valid queries can return misleading results.
 What business activity or state are we measuring?
- What exactly would one row represent?
- Which values are recorded at that same level of detail?
- Which dates, people, products, locations, and statuses describe it?
- How should the measures behave when users group and filter them?
- Which definitions need to remain consistent across other models?
Dimensional modelling turns those questions into an explicit analytical design. It organises measurable business activity as facts and the descriptive context around that activity as dimensions.
Design from the Business Activity
An operational database is usually organised around application behaviour, transactions, validation, and efficient updates. Its tables are valuable evidence about the data, but they aren’t an analytical design brief.
Copying source tables into a warehouse can preserve the source’s complexity without establishing:
- Which business process should the model represent?
- What would one analytical row mean?
- Which measures could be combined safely?
- Which definitions need to be shared across operational boundaries?
- How should historical changes affect earlier results?
A dimensional model starts from the activity people need to understand. Sales, order fulfilment, inventory, procurement, claims, subscriptions, and support cases are examples of business processes that produce measurable events or states.
The model should be developed with people who understand both the business process and the available data. A business definition that isn’t captured by the source won’t become implementable simply because it appears in a workshop diagram.
Kimball’s Four Design Decisions
The Kimball Group’s four-step dimensional design process provides a useful sequence:
- 1Select the business process
Choose the measurable activity or state the model needs to represent.
- 2Declare the grain
State precisely what one row in the fact table will mean.
- 3Identify the dimensions
Determine the descriptive contexts that apply at that grain.
- 4Identify the facts
Select measurements that exist at the declared grain and define how they behave.
The decisions stay the same when the subject changes. Their answers do not:
| Domain and process | Possible grain | Candidate dimensions | Candidate facts or state |
|---|---|---|---|
| Order fulfilment | One recorded dispatch of one order line | Customer, item, location, carrier, dates | Quantity, value, elapsed time |
| Insurance claims | One adjudication decision for one claim item | Policy, claimant, coverage, assessor, dates | Approved amount, rejected amount, decision time |
| Loan servicing | One account balance at the end of one day | Borrower, product, risk band, branch, date | Principal balance, arrears balance, days past due |
| Customer support | One completed handling event for one case | Customer, issue type, channel, team, dates | Handling time, wait time, resolution count |
These examples aren’t interchangeable templates. They show why the business process and grain must be established before a team chooses familiar-looking dimensions or measures.
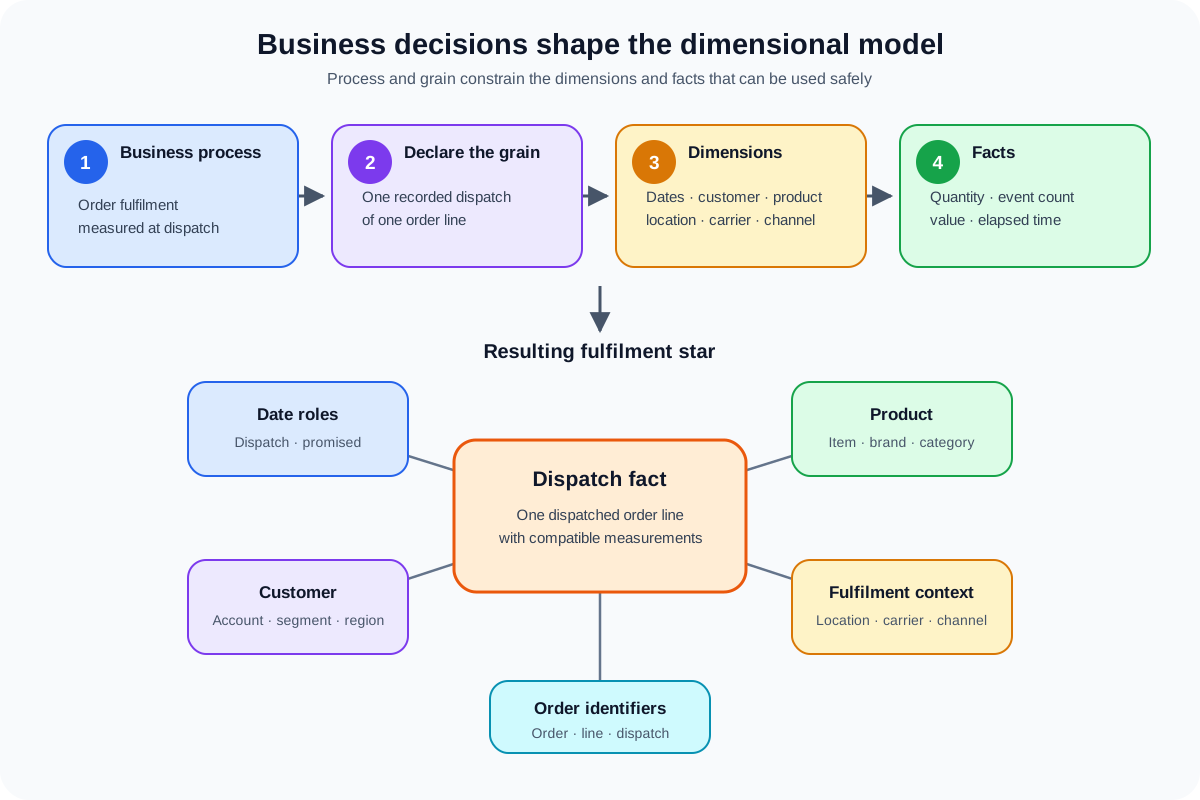
Business process and grain constrain the dimensions and facts that can appear in the resulting model.
The sequence is important. Beginning with a convenient measure or a collection of dimensions can conceal that they describe different events or levels of detail.
1. Select the Business Process
“Sales” may be too broad to describe one process. An organisation could separately record:
 Quotations issued
- Orders placed
- Order lines allocated
- Goods dispatched
- Invoices raised
- Payments received
- Returns accepted
These events are related, but they occur at different times, may come from different systems, and answer different questions. Treating them as one undifferentiated fact can confuse demand, fulfilment, revenue, cash, and returns.
Suppose the immediate requirement is to understand fulfilment performance: what was dispatched, when, from where, for which customer, and whether the dispatch met its commitment. The selected process is therefore order fulfilment, with dispatch as the measurable event.
2. Declare the Grain
The grain is a plain-language statement of what one fact row represents. It should be declared before choosing dimensions and facts.
For the fulfilment example, a candidate declaration is:
One row represents one recorded dispatch of one product line from one sales order.
In another domain, the same discipline might produce “one row per claim-item adjudication decision”, “one row per loan account at the end of each business day”, or “one row per completed support-case handling event”. Each statement creates different rules for uniqueness, valid measures, and descriptive context.
That sentence is a design contract. It establishes that:
 A split shipment can produce several rows for one order line.
- Every fact must describe the individual dispatched line, unless a documented allocation is applied.
- Dimensions must be known or assignable for that dispatch event.
- Counting rows counts dispatched lines, not necessarily orders, products, or customers.
- Measures recorded only once per order can't be copied onto every dispatch row and summed safely.
Grain is more precise than saying “daily”, “customer level”, or “transactional”. Those phrases describe only part of a row’s identity.
The same broader process can be viewed in several legitimate ways. One model can record each dispatch event. Another can take a daily picture of open work. A third can keep one row per order line and update milestone dates as it progresses.
| Question we need to answer | What one row represents | Formal name |
|---|---|---|
| What was dispatched? | One dispatched order line | Transaction fact |
| How much work was open each day? | One open order line at the end of one day | Periodic snapshot |
| How long passed between milestones? | One order line, updated as allocation, dispatch, and delivery occur | Accumulating snapshot |
The formal names help practitioners recognise familiar patterns, but the row meaning is the important decision. These designs aren’t interchangeable: one records events, one deliberately repeats a state across dates, and one updates a row as a process progresses.
Microsoft’s fact-table modelling guidance describes these transaction, periodic-snapshot, and accumulating-snapshot patterns in more detail.
3. Identify the Dimensions
Dimensions provide the descriptive context used to filter, group, label, and navigate facts. They answer questions such as who, what, when, where, how, and why.
For a dispatched order line, candidate dimensions might include:
- Dispatch date: When did the event occur?
- Promised date: Against which commitment should it be assessed?
- Customer: For whom was the order fulfilled?
- Product: Which item was dispatched?
- Dispatch location: Which site supplied it?
- Carrier and service: How was it sent?
- Sales channel: Through which route was the order received?
The dimensions must apply at the fact’s grain. If a carrier isn’t known for each dispatched line, the design needs to establish whether it can be inherited safely from a shipment, represented as unknown, or modelled differently.
Dimensions should use business language
A dimension should translate operational codes and structures into terminology its intended users recognise. A product dimension might bring together item, brand, category, and lifecycle status. A policy dimension might expose coverage family, scheme, and regulatory classification; a loan dimension might expose facility type, repayment basis, and risk category. Readers shouldn’t need to reconstruct these meanings through several coded source tables.
This denormalised shape is characteristic of a star schema. A central fact table joins directly to comparatively wide dimensions, which makes common analytical paths easier to understand and often reduces query joins.
Shared descriptions prevent conflicting answers
Dispatch, invoice, return, and inventory models may all need compatible customer, item, and calendar descriptions. A lender may need the same borrower, account, branch, and risk definitions across applications, payments, balances, and arrears. If each team invents incompatible categories or hierarchies, cross-process analysis becomes unreliable.
Agreeing which descriptions should be reusable is therefore part of the design. The optional vocabulary section later in this article gives formal names to this and several other recurring modelling patterns.
4. Identify the Facts
Facts are measurements, events, or states recorded at the declared grain. For one dispatched order line, possible numeric facts include:
- Dispatched quantity
- Dispatch-event count, usually stored or interpreted as one
- Extended selling value assigned to the dispatched quantity
- Elapsed time between order and dispatch
- Variance from the promised dispatch date
- Weight or volume dispatched
Each candidate needs a source, definition, unit, and aggregation rule. A useful measure isn’t automatically a valid fact for this table.
Not every number can be totalled in the same way
A dispatched quantity can usually be added across items and dates. An end-of-day loan balance can be added across accounts, but adding Monday’s balance to Tuesday’s is normally meaningless. A percentage should usually be recalculated from its components. Without these rules, a dashboard can display a plausible but invalid total.
| Example | Safe behaviour | Formal term |
|---|---|---|
| Dispatched quantity in one consistent unit | Can usually be summed across all related dimensions | Additive |
| End-of-day loan balance | Can be summed across accounts or branches, but not across dates | Semi-additive |
| Claim approval rate | Shouldn’t normally be summed; calculate it from compatible components | Non-additive |
For a rate such as on-time dispatch percentage, storing additive components is often safer: eligible dispatch count and on-time dispatch count. Consumers can sum those components within a valid context and then divide them.
Currency needs similar care. Revenue recorded in several currencies isn’t additive until a conversion policy establishes a common basis, rate date, rate type, and correction approach.
The Star Schema That Emerges
The fulfilment model now has a central dispatch fact linked directly to descriptive dimensions. The fact contains dimension keys, compatible measurements, and potentially transaction identifiers such as order number and line number.
The star shape isn’t imposed before the business decisions. It emerges from them:
- The selected process identifies the activity being modelled.
- The grain defines the meaning and uniqueness of a fact row.
- The dimensions describe each event at that grain.
- The facts measure the event and state how aggregation should work.
Microsoft’s dimensional-modelling guidance for Fabric Warehouse similarly describes fact tables as measurements of observations or events and dimensions as the business entities that provide analytical context. Those principles aren’t specific to Fabric.
Useful Modelling Vocabulary
The four design decisions are the main story. The following terms help practitioners discuss situations that recur across dimensional models, but decision makers don’t need to memorise them to understand the design.
- Conformed dimensions: Reusable customer, product, calendar, or other descriptions that retain compatible meanings across several fact tables.
- Role-playing dimensions: One reusable dimension serving several clearly named purposes, such as order date, promised date, dispatch date, and delivery date.
- Fact-table patterns: Transaction facts record events, periodic snapshots record state at regular intervals, and accumulating snapshots follow milestones in a process.
- Factless fact tables: Rows record that an event or relationship occurred even when there is no conventional numeric measurement; attendance or eligibility can be analysed by counting rows.
For example, the warehouse may store one physical calendar dimension while a model exposes it through several named date roles. Likewise, dimensions can be reused without every fact table relating to them at exactly the same level of detail; their definitions and roll-ups still need to remain compatible.
Star or Snowflake?
A descriptive hierarchy can be presented in one analyst-facing dimension or divided into related tables. The choice applies to structures such as product categories, organisational units, account classifications, clinical specialties, and geographic hierarchies.
The diagram continues the fulfilment example: a product can be presented in one table containing its item, subcategory, category, brand, and supplier descriptions, or some of those levels can be stored in separate related tables.
The first arrangement contributes to a star schema, with a direct path from facts to comparatively wide dimensions. The second is a snowflake schema, in which some dimension attributes are normalised into related tables.
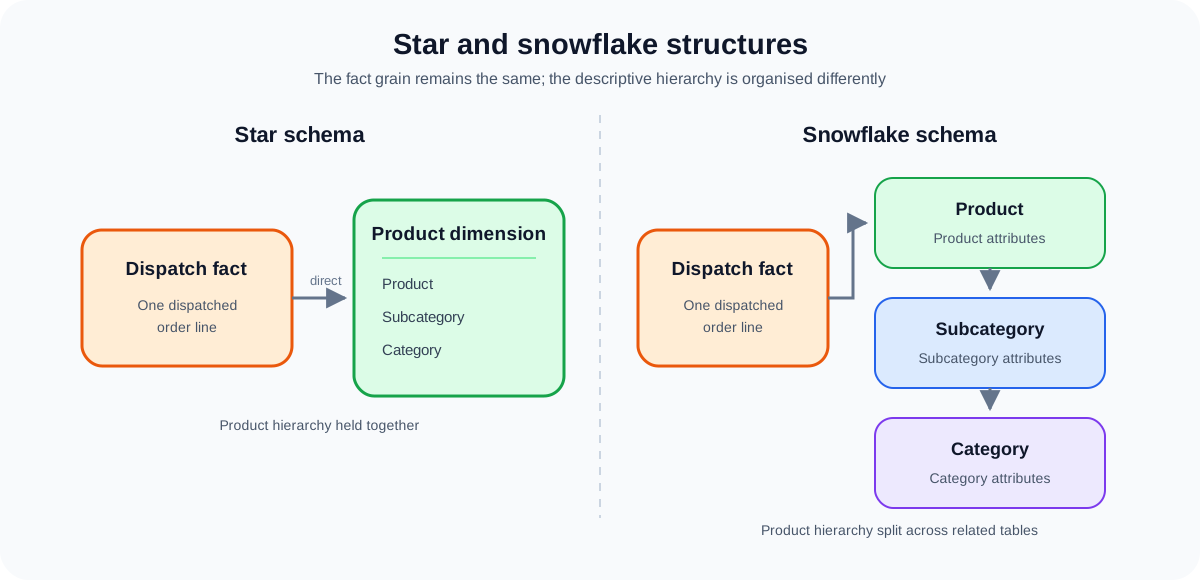
Both structures retain the dispatch fact grain, but they organise descriptive product attributes differently.
| Consideration | Star-shaped dimension | Snowflaked dimension |
|---|---|---|
| User navigation | Fewer joins and a more direct analytical path | More relationships for users and tools to understand |
| Repeated descriptions | Descriptive values may be repeated across dimension rows | Shared descriptions can be stored once |
| Hierarchy governance | Hierarchy is presented together within the dimension | Separate entities may support independently managed structures |
| Query behaviour | Often simpler queries with fewer joins | Additional joins may affect simplicity and performance |
| Change impact | Convenient for analytical use, but requires dimension processing | A shared normalised table can centralise certain changes |
For many reporting models, a star is the clearer default. Snowflaking can still be reasonable when a subdimension is large, shared, independently governed, or genuinely reused in ways that justify the added relationships.
This isn’t a contest for the fewest tables. The design should make valid analysis understandable and maintainable within the platform and operating context.
Common Modelling Failures
 Mixing order-level and order-line values without a documented allocation.
- Choosing facts before stating what a row represents.
- Using a current source attribute to describe historical events without acknowledging restatement.
- Creating incompatible shared-entity or classification definitions for every departmental model.
- Treating percentages and balances as if they were additive across every dimension.
- Replicating a complex operational model and calling the result dimensional.
- Adding every available attribute without a requirement, definition, or owner.
- Assuming a visually correct star schema proves that the data reconciles.
Evidence the Model Is Usable
A design review shouldn’t end when the boxes look tidy. Useful evidence includes:
- A written grain statement that business and technical participants interpret consistently.
- Example questions that the proposed facts and dimensions can answer without hidden joins or allocations.
- Source evidence showing that required dimensions and measurements exist at the declared grain.
- Aggregation rules for additive, semi-additive, and non-additive measures.
- Reconciliation criteria at total and meaningful dimensional levels.
- Named owners for shared dimensions, measures, classifications, and future changes.
- Known exclusions and unsupported questions documented alongside the model.
For readers who want a concrete implementation after the general design method, an optional AdventureWorks case study on this site applies these ideas to a sales-order-line star schema, including surrogate keys, unknown members, dimensional loading, and financial reconciliation.
Questions to Take into Historical Design
Dimensions describe facts, but those descriptions change. Customers move, products or policies are reclassified, borrowers change risk bands, organisational structures are reorganised, and corrections arrive after results have been published.
- Should past facts retain the description that was valid when the event occurred?
- Should a correction update all history or only future reporting?
- Which source changes represent a new business state rather than a corrected error?
- Can the source provide effective dates or only its latest value?
- Which dimensions need versioned history and which can remain current-state?
- How should late-arriving facts find the correct historical dimension member?
Those decisions lead into the next article, which examines current-state replacement, versioned dimensions, effective dates, late-arriving data, corrections, and the limits of reconstructing history that was never captured.