

In the first article in this series, I outlined the plan to build a sales analytics solution from the AdventureWorks2025 operational database.
The next step is to understand how a sale is represented in the data.
This is easy to rush. A database contains tables with names such as SalesOrderHeader, Customer, and Product, so it can feel as though the analytical path is already obvious. In practice, the important questions appear once you inspect the relationships and the grain of each table.
The important decisions only become clear once I understand what one row represents, how the main entities connect, and which geographic and financial definitions the database actually supports.
Those decisions affect every result that follows.
This article is part of a twelve-part SQL sales analytics project based on AdventureWorks2025, supported by the sql-sales-analytics-portfolio repository.
Reproduce the Analysis
To reproduce this article, run the complete data-landscape exploration script against AdventureWorks2025 in SQL Server Management Studio. The script is read-only and contains the queries used to inspect row counts, relationships, customer types, dates, order statuses, and financial measures.
The sales data landscape diagram is also available separately.

The Business Problem
Adventure Works wants to analyse sales across customers, products, regions, channels, and time.
Before writing those analytical queries, I need a reliable map of the operational data that can answer five practical questions:
 Where is the transaction recorded?
- How do order-level and product-level data connect?
- How are individuals and stores represented as customers?
- Which paths provide product and geographic context?
- Which columns could become measures in later analysis?
The aim isn’t to document the entire database. AdventureWorks2025 contains data for areas such as purchasing, manufacturing, employees, and product inventory. They may become relevant later, but including every available table now would make the sales model harder to understand.
I want the smallest useful map that preserves the important business relationships.
I am not treating this model as an example of how a modern sales database ought to be designed. I am approaching it as an inherited operational system whose relationships and conventions must be understood before its data can be analysed safely. The awkward parts of the model are therefore findings to work with, not patterns to copy without question.
Start with the Database, Not a Diagram
Entity relationship diagrams are useful, but I prefer to inspect the database metadata first. That keeps the diagram grounded in the version I’m actually using.
The following query lists row counts for the main sales tables:
SELECT
    s.name AS SchemaName,
    t.name AS TableName,
    SUM(p.rows) AS TableRows
FROM sys.tables AS t
INNER JOIN sys.schemas AS s
    ON s.schema_id = t.schema_id
INNER JOIN sys.partitions AS p
    ON p.object_id = t.object_id
   AND p.index_id IN (0, 1)
WHERE
    (s.name = 'Sales' AND t.name IN
        ('Customer', 'SalesOrderHeader', 'SalesOrderDetail',
         'SalesPerson', 'SalesTerritory', 'Store'))
    OR
    (s.name = 'Production' AND t.name IN
        ('Product', 'ProductSubcategory', 'ProductCategory'))
GROUP BY
    s.name,
    t.name
ORDER BY
    s.name,
    t.name;
In my restored copy of AdventureWorks2025, the core tables contain:
| Table | Rows | Analytical role |
|---|---|---|
Sales.SalesOrderHeader |
31,465 | One row per sales order |
Sales.SalesOrderDetail |
121,317 | One row per recorded order line |
Sales.Customer |
19,820 | Customer account used by an order |
Sales.Store |
701 | Store or reseller details |
Sales.SalesPerson |
17 | Salesperson attributes |
Sales.SalesTerritory |
10 | Sales territory names and groups |
Production.Product |
504 | Product-level attributes |
Production.ProductSubcategory |
37 | Product subcategories |
Production.ProductCategory |
4 | High-level product categories |
The table row-count query supplies these figures directly from SQL Server’s catalogue views.
Row counts don’t explain the model, but they give an early indication of grain. On average, there are almost four order lines per order, so any query that joins headers to details will repeat order-level columns across multiple rows.
That is one of the easiest ways to overstate a sales total.
The Core Sales Path
The central transaction is split between two tables:
Sales.SalesOrderHeaderrecords the order-level event.Sales.SalesOrderDetailrecords the products purchased within that order.
SalesOrderID connects them in a one-to-many relationship.
The header includes the customer, order dates, channel flag, salesperson, sales territory, billing and shipping addresses, subtotal, tax, freight, and total due. The detail includes the product, quantity, unit price, discount, and calculated line total.
From there, the analytical path branches into customer, product, salesperson, territory, and address data.
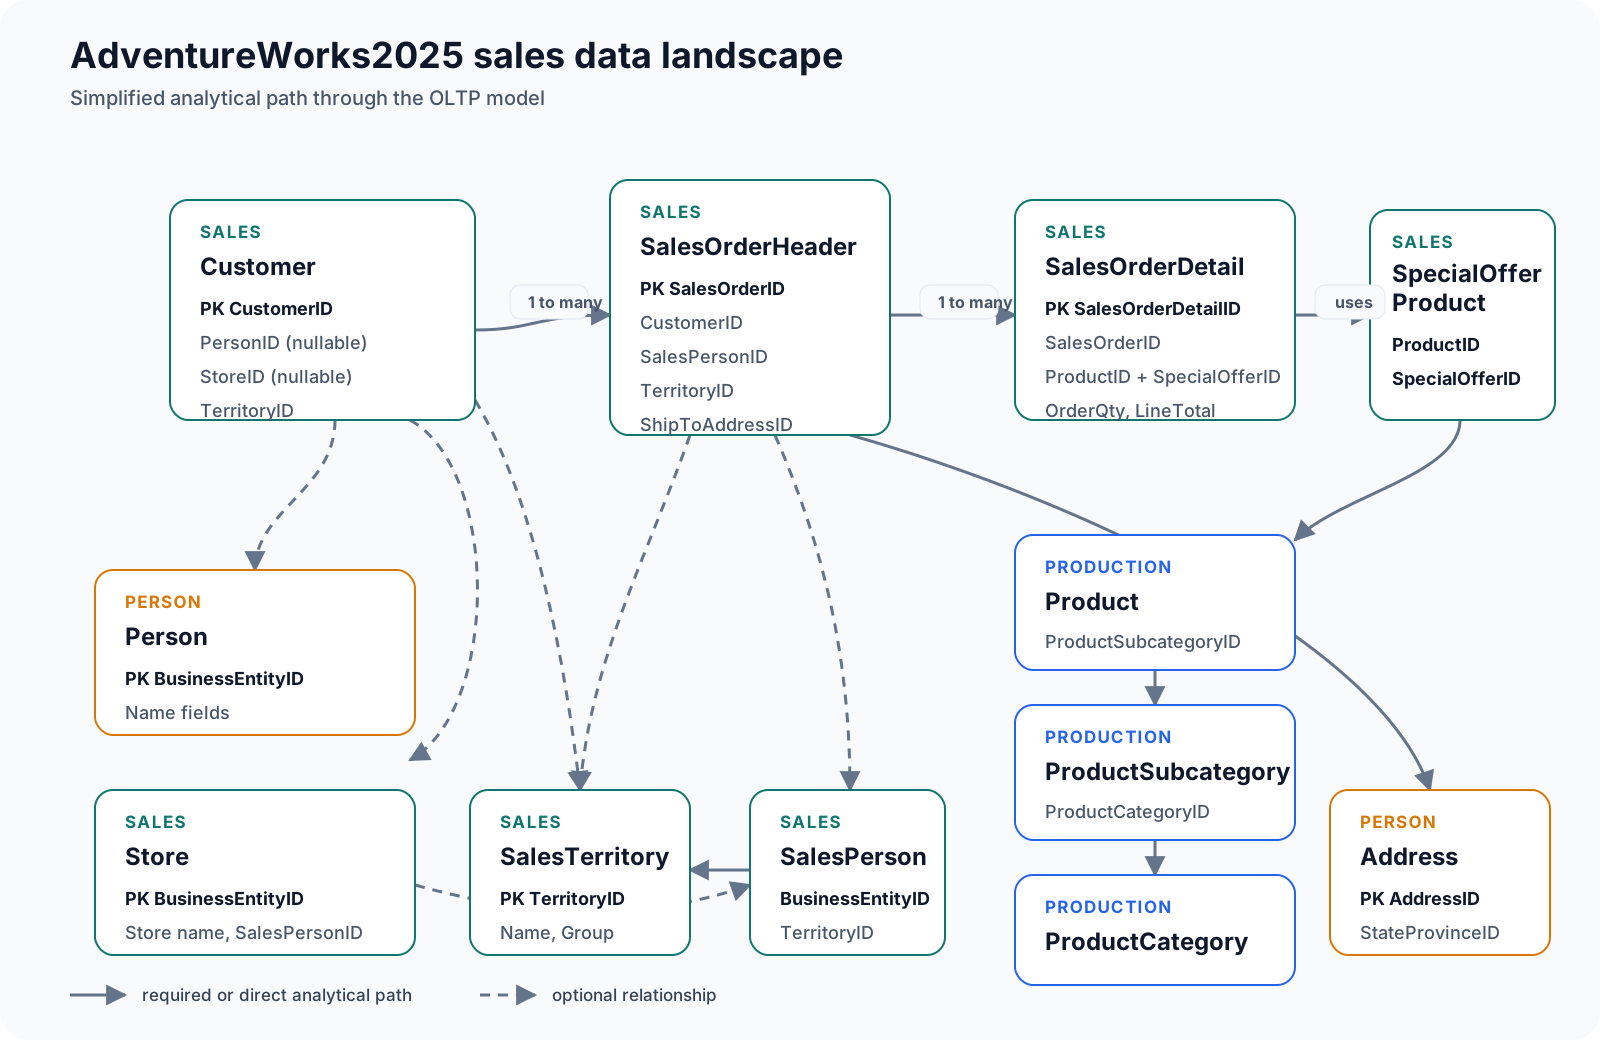
A focused view of the relationships needed for the first stages of sales analysis. The full operational database contains additional tables and paths.
This diagram is deliberately selective. It shows the tables that help explain the sale without trying to reproduce every foreign key in AdventureWorks2025.
The supporting script’s foreign-key inspection query provides the database evidence behind the paths shown in the diagram.
Understanding the Grain
Grain describes what one row represents.
This sounds like a modelling term, but it has an immediate practical effect on SQL. Consider an order containing twelve recorded line items. The order header appears once, while the joined result contains twelve rows.
If I sum SalesOrderHeader.TotalDue after joining to SalesOrderDetail, that order’s value will be counted twelve times.
For order-level questions such as order frequency or average order value, the natural starting point is SalesOrderHeader. For product contribution, quantity sold, and category performance, the query needs SalesOrderDetail.
The database contains:
- 31,465 orders
- 121,317 order lines
- 3.86 lines per order on average
The order and order-line profile queries calculate these values at their respective grains.
The precise wording matters here. SalesOrderDetail is keyed by SalesOrderID and SalesOrderDetailID, so each row represents a recorded line item rather than a product that is guaranteed to appear only once on an order. ProductID isn’t unique within SalesOrderID. The current data happens to contain no repeated order-and-product combinations, but the database constraint doesn’t promise that future data will behave the same way.
Neither table is universally better. The correct grain depends on the business question.
Following One Sale Through the Model
A useful way to test the map is to trace orders from the transaction to their customer, territory, and product hierarchy.
SELECT TOP (20)
    soh.SalesOrderID,
    soh.OrderDate,
    CASE
        WHEN soh.OnlineOrderFlag = 1 THEN 'Online'
        ELSE 'Salesperson'
    END AS SalesChannel,
    CASE
        WHEN c.StoreID IS NOT NULL THEN 'Store'
        ELSE 'Individual'
    END AS CustomerType,
    COALESCE(
        store_customer.Name,
        CONCAT(person_customer.FirstName, ' ', person_customer.LastName)
    ) AS CustomerName,
    territory.Name AS SalesTerritory,
    category.Name AS ProductCategory,
    subcategory.Name AS ProductSubcategory,
    product.Name AS ProductName,
    sod.OrderQty,
    sod.LineTotal
FROM Sales.SalesOrderHeader AS soh
INNER JOIN Sales.SalesOrderDetail AS sod
    ON sod.SalesOrderID = soh.SalesOrderID
INNER JOIN Sales.Customer AS c
    ON c.CustomerID = soh.CustomerID
LEFT JOIN Person.Person AS person_customer
    ON person_customer.BusinessEntityID = c.PersonID
LEFT JOIN Sales.Store AS store_customer
    ON store_customer.BusinessEntityID = c.StoreID
LEFT JOIN Sales.SalesTerritory AS territory
    ON territory.TerritoryID = soh.TerritoryID
INNER JOIN Sales.SpecialOfferProduct AS sop
    ON sop.SpecialOfferID = sod.SpecialOfferID
   AND sop.ProductID = sod.ProductID
INNER JOIN Production.Product AS product
    ON product.ProductID = sop.ProductID
LEFT JOIN Production.ProductSubcategory AS subcategory
    ON subcategory.ProductSubcategoryID = product.ProductSubcategoryID
LEFT JOIN Production.ProductCategory AS category
    ON category.ProductCategoryID = subcategory.ProductCategoryID
ORDER BY
    soh.SalesOrderID,
    sod.SalesOrderDetailID;
The query isn’t intended as a final reporting view. It is a diagnostic query that proves the main analytical path works and exposes a few design choices.
The complete core sales-path query is available in the supporting script.
One subtle point is the relationship between an order line and a product. SalesOrderDetail uses ProductID together with SpecialOfferID to reference Sales.SpecialOfferProduct. That bridge then connects to Production.Product and the optional product hierarchy.
It would be easy to overlook SpecialOfferProduct and join the detail directly to Product. The product identifier supports that in practice, but following the declared relationship makes the role of offers explicit and gives us a cleaner foundation for later discount analysis.
A Customer Isn’t Necessarily a Person
Sales.Customer is the customer account attached to an order. It can point to:
Person.PersonthroughPersonIDSales.StorethroughStoreIDSales.SalesTerritorythroughTerritoryID
It is tempting to interpret PersonID and StoreID as two mutually exclusive customer types. Profiling the columns shows a more nuanced shape:
| Customer record shape | Records |
|---|---|
| Person only | 18,484 |
| Store only | 701 |
| Person and store | 635 |
The customer-shape query generates this profile without assuming that PersonID and StoreID are mutually exclusive.
Those 635 records matter. A simple rule based on PersonID IS NOT NULL would classify them as individuals even though they also reference a store.
For the exploratory query, I treat a record with StoreID as a store customer and use the store name. That is a working interpretation, not a universal definition that should be hidden inside every future query.
Article 4 will establish reusable business logic after the data quality work. Until then, keeping assumptions visible is safer than pretending the schema has already answered the business question for us.
Sales Channel and Salesperson
SalesOrderHeader.OnlineOrderFlag distinguishes the two order routes:
1means the customer placed the order online.0means a salesperson placed the order.
The local data contains 27,659 online orders and 3,806 salesperson-assisted orders. Every online order has a null SalesPersonID, while every salesperson-assisted order has one populated. The order-route and salesperson query supplies both findings.
That clean relationship makes the flag a credible starting point for channel analysis. It also explains why SalesPersonID is nullable rather than missing through poor data quality.
This distinction will become useful when we compare customer behaviour. Online orders and store sales may have different order sizes, product mixes, and purchasing patterns, but those are hypotheses for later articles rather than conclusions we should draw from the schema alone.
Three Ways to Think About Geography
AdventureWorks2025 provides several geographic paths:
Sales.Customer.TerritoryIDdescribes the territory associated with the customer account.SalesOrderHeader.TerritoryIDdescribes the territory in which the sale was made.ShipToAddressIDandBillToAddressIDconnect an order toPerson.Address, which continues through state or province and country tables.
These paths may produce similar groupings, but they don’t represent the same business idea.
If the question is about sales management performance, the order territory may be appropriate. If the question concerns delivery demand or logistics, the shipping address is more useful. Customer territory could support account ownership or customer-base analysis.
Choosing one without naming the meaning creates a metric that looks precise but is hard to explain.
Dates and Order Status
The order header contains three operational dates:
OrderDateDueDateShipDate
For sales trends, OrderDate is the likely default. Shipping performance would use a different combination.
The restored AdventureWorks2025 data covers orders from 30 May 2022 to 29 June 2025. All 31,465 orders currently have status 5, which the database metadata describes as shipped. These findings come from the order-period query and status profile.
That means order status won’t provide a useful segmentation in this static sample. It is still worth checking. Assuming a column contains analytical variation because it exists in the schema can waste time and produce empty comparisons.
What Counts as Sales Value?
Several columns could be mistaken for revenue:
| Column | Grain | Meaning |
|---|---|---|
SalesOrderDetail.LineTotal |
Order line | Quantity multiplied by unit price after the line discount |
SalesOrderHeader.SubTotal |
Order | Sum of the order’s line totals |
SalesOrderHeader.TaxAmt |
Order | Tax charged on the order |
SalesOrderHeader.Freight |
Order | Freight charged on the order |
SalesOrderHeader.TotalDue |
Order | Subtotal plus tax and freight |
The financial-grain query displays the line total, subtotal, tax, freight, and total due together for the same orders.
For product performance, line total is the useful measure because it can be attributed to a product. For customer order value, subtotal or total due may be appropriate depending on whether the question should include tax and freight.
Calling all of them “sales” would make later comparisons difficult. I will normally use line value or subtotal for product and commercial performance, then name tax, freight, and total due explicitly when they matter.
The Analytical Questions This Model Supports
With the main relationships understood, the database can support questions such as:
- How often do customers order, and how does behaviour differ between individuals and stores?
- Which products and categories contribute the most line value and quantity?
- How does sales performance vary by order territory or shipping geography?
- How do online and salesperson-assisted orders differ?
- How are sales, order counts, and average order value changing over time?
- Which definitions and joins should become reusable views?
It also exposes questions that need to be resolved before analysis:
- Are person and store links complete and consistent?
- Do all order lines reference valid products and offers?
- Are order dates, shipping dates, quantities, prices, and discounts plausible?
- Are there duplicate business records even where primary keys are unique?
- Which geography should be used for each reporting objective?
Those are data quality and business-definition questions, which is exactly where the project should go next.
Key Decisions from the Exploration
The initial model gives us a few working decisions:
- Use
SalesOrderHeaderfor order-level metrics. - Use
SalesOrderDetailfor product-level metrics. - Keep store and individual customer logic explicit until it is standardised.
- Use the order territory for sales-performance questions unless another geographic meaning is stated.
- Use line total or subtotal as the default commercial sales value, excluding tax and freight.
- Treat
OrderDateas the default date for sales trends.
These aren’t permanent rules. They are documented starting points that can be tested against the data and refined when the business question changes.
Next in the Series
The next article will assess the quality of the data behind this model.
I’ll check missing values, duplicates, invalid ranges, date relationships, and referential integrity. The aim will be to distinguish expected nulls and structural choices from issues that could undermine the analysis.