

The previous article improved analytical queries over the operational sales model. Better predicates, appropriate indexes, and correct grain reduced the work, but the reporting layer still begins with a schema designed to process business transactions.
This article takes the next step. I build a small dimensional model from the AdventureWorks2025 OLTP database and validate it against the analytical views created earlier in the series.
The goal isn’t to reproduce every feature of an enterprise warehouse. It is to create a dependable star schema that reflects the questions the project has already needed to answer.
This article is part of a twelve-part SQL sales analytics project based on AdventureWorks2025, supported by the sql-sales-analytics-portfolio repository.
SQL Sales Analytics Project Series
- Building a Sales Analytics Solution with SQL: Project Overview
- Understanding the Sales Data Landscape with SQL
- Assessing Sales Data Quality with SQL
- Preparing Sales Data for Analysis with SQL
- Analysing Customer Purchasing Behaviour with SQL
- Measuring Product Performance with SQL
- Analysing Regional Sales Performance with SQL
- Time-Series Analysis with SQL
- Using Advanced SQL to Generate Business Insights
- Optimising SQL for Analytical Workloads
- Designing an Analytics-Friendly Data Model ← You are here
- Completing a SQL Sales Analytics Project
Reproduce the Model
This article depends on the Analytics views created in Article 4. If they aren’t installed, run the analytical view creation script first.
Then run the dimensional-model creation script against AdventureWorks2025, followed by the validation script.
The creation script adds a project-owned AnalyticsDW schema and six tables. It stops if that schema already contains tables, so it won’t silently replace a previous load. If it reports error 50002, the model is already installed and you can proceed to the validation script. The validation script is read-only.
Unlike the temporary index in Article 10, this model is intended to remain installed. It doesn’t alter any AdventureWorks source table or the existing Analytics views.
The Modelling Problem
The operational schema preserves transactions well, but analytical questions repeatedly need the same work:
- Navigate from order lines through headers, customers, products, and territories
- Reconstruct product categories from several normalized tables
- Derive calendar attributes from transaction dates
- Keep order and order-line measures at the correct grain
- Apply the same customer and channel definitions in every query
The reusable views simplified those joins without changing the underlying shape. A dimensional model goes further by organizing data around measurable business events and the descriptive contexts used to analyse them.
I use a star schema with one central fact table and five dimensions.
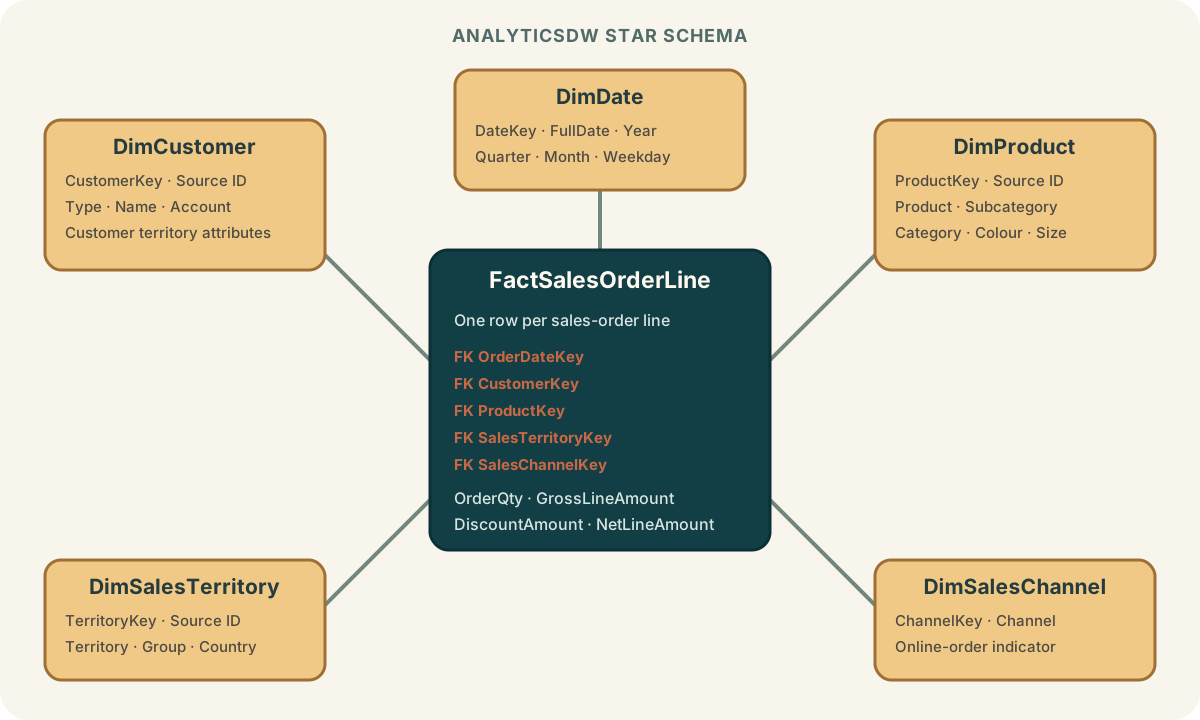
The implemented AnalyticsDW model. The diagram is also available in the supporting repository.

Declaring the Fact Grain
The most important design decision is the grain of the fact table:
One row in
AnalyticsDW.FactSalesOrderLinerepresents one recorded product line on one sales order.
That declaration determines what the table can store safely. Quantity, gross line amount, discount amount, and net line amount all exist at order-line grain. SourceSalesOrderID and SalesOrderNumber remain available as degenerate transaction identifiers, while the composite source order and line identifiers are constrained to be unique.
The fact-table definition also stores foreign keys to the five dimensions.
I deliberately don’t copy order-level tax, freight, or total due into every fact row. Doing that would repeat those amounts once per product line and make ordinary sums wrong. A more complete warehouse could add a separate order-grain fact table or define an allocation rule, but neither should happen implicitly.
This line-grain fact supports the main questions from the series:
- Product and category contribution
- Customer purchasing across products and time
- Territory and channel mix
- Monthly quantity and net sales trends
- Discount analysis at the level where discounts are recorded
It still requires COUNT(DISTINCT SourceSalesOrderID) when a query asks for orders rather than lines. Dimensional modelling makes the grain explicit; it doesn’t remove the need to respect it.
Designing the Dimensions
The dimension definitions create five reusable analytical contexts.
Date
DimDate provides one row per calendar date from 30 May 2022 to 29 June 2025. The date-dimension load generates 1,127 continuous dates, including days with no orders.
The integer DateKey uses YYYYMMDD form, while FullDate remains available as an actual SQL date. Year, quarter, month, month start, day of month, and weekday attributes can now be used consistently without repeating expressions in every report.
A production calendar would probably include financial periods, working-day indicators, holidays, and organization-specific trading calendars. I haven’t invented those definitions without business input.
Customer
DimCustomer contains all 19,820 source customer accounts, not only the 19,119 accounts with orders. That preserves potential reporting on non-ordering accounts and makes the dimension useful beyond the current fact load.
Customer type, display name, account number, person or store identifiers, and current customer-territory attributes are stored together. This is intentionally a current-state dimension. It doesn’t reconstruct historical customer names or territory assignments that the source never captured as effective-dated versions.
Product
DimProduct contains all 504 source products, including products with no recorded sales. Product, subcategory, and category attributes are flattened into one dimension so category analysis no longer needs to traverse the normalized production hierarchy.
The dimension keeps product colour, size, and selling dates, but it doesn’t claim that current product attributes reproduce every historical catalogue state. Supporting historical changes would require source history and a slowly changing dimension strategy.
Sales territory and channel
DimSalesTerritory contains the ten source territories with their group and country-region code. DimSalesChannel contains the two observed routes, Online and Salesperson.
Channel could have remained a text value in the fact table because it is small and stable. I use a dimension to give the business concept a controlled definition and a place for future attributes. That is a judgement call rather than a universal rule.
The complete dimension-loading section supplies the source mappings and controlled defaults.
Why Use Surrogate Keys?
Each descriptive dimension has a warehouse-managed key such as CustomerKey or ProductKey. The original AdventureWorks identifier is retained separately.
This separation provides several benefits:
- A warehouse key can identify a particular dimension version if slowly changing history is added later.
- Facts don’t depend directly on the operational system’s key format.
- Several source systems could eventually map into one conformed dimension.
- A controlled unknown member can receive facts whose source reference is missing or arrives late.
The model creates key 0 as the unknown member for customer, product, territory, and channel. The current load doesn’t use those rows because every fact resolves successfully, but the pattern prevents a future incomplete reference from forcing either a failed load or a null foreign key.

An identity column makes versioned dimensions possible, but historical tracking also needs change detection, effective dates, current-row indicators, and a load process that assigns facts to the correct version. This first model performs a current-state full load.
Loading the Fact Table
The fact-loading query starts from Analytics.vwSalesOrderLines and resolves each descriptive source identifier to its dimension key.
LEFT JOIN AnalyticsDW.DimCustomer AS customer
    ON customer.SourceCustomerID = sales_line.CustomerID
LEFT JOIN AnalyticsDW.DimProduct AS product
    ON product.SourceProductID = sales_line.ProductID
COALESCE assigns the unknown key if a lookup fails. Date uses an inner join because the continuous date dimension is generated directly from the observed order boundary.
The entire build runs in one transaction with XACT_ABORT ON. The first attempted load exposed a product-size width that was too narrow for the controlled Unknown value. SQL Server rolled back the transaction, I corrected the model, and the next run completed. That is useful behaviour for a rebuild: a failed load shouldn’t leave a partially populated star schema.
Three fact-table indexes support common date, customer, and product paths. They are reasonable starting points for this project, not a substitute for measuring the eventual BI workload.
Validating the Model
Creating tables successfully doesn’t prove that the data model is correct. I validate row preservation, key uniqueness, dimension resolution, and financial reconciliation.
Dimension coverage
| Dimension | Model rows | Source members | Explanation |
|---|---|---|---|
| Date | 1,127 | 1,127 dates | Continuous observed range |
| Customer | 19,821 | 19,820 accounts | Includes one unknown member |
| Product | 505 | 504 products | Includes one unknown member |
| Sales territory | 11 | 10 territories | Includes one unknown member |
| Sales channel | 3 | 2 observed channels | Includes one unknown member |
The dimension validation query checks model keys and source identifiers together.
Fact grain and dimension resolution
The fact table contains 121,317 rows, matching the analytical order-line view exactly. It also contains 121,317 distinct fact keys, 121,317 distinct source order lines, and 31,465 distinct orders.
The fact-grain query produces those counts. The unknown-member check returns zero unresolved customers, products, territories, and channels.
Financial reconciliation
| Measure | Source | Fact table | Difference |
|---|---|---|---|
| Gross line amount | $110,373,889.31 | $110,373,889.31 | $0.00 |
| Discount amount | $527,507.91 | $527,507.91 | $0.00 |
| Net line amount | $109,846,381.40 | $109,846,381.40 | $0.00 |
The financial reconciliation query compares complete source and fact totals. A second category-level reconciliation confirms that quantities and net values also agree for Accessories, Bikes, Clothing, and Components.

A matching grand total can hide values assigned to the wrong member. Checking category results as well as complete totals gives stronger evidence that dimension resolution and measures survived the transformation.
Querying the Star Schema
Once loaded, a monthly category query begins with the fact and joins only the dimensions that supply the requested context.
SELECT
    date_dimension.CalendarYear,
    date_dimension.MonthNumber,
    product.ProductCategory,
    SUM(fact.OrderQty) AS QuantitySold,
    SUM(fact.NetLineAmount) AS NetSalesValue
FROM AnalyticsDW.FactSalesOrderLine AS fact
INNER JOIN AnalyticsDW.DimDate AS date_dimension
    ON date_dimension.DateKey = fact.OrderDateKey
INNER JOIN AnalyticsDW.DimProduct AS product
    ON product.ProductKey = fact.ProductKey
GROUP BY
    date_dimension.CalendarYear,
    date_dimension.MonthNumber,
    product.ProductCategory;
The complete demonstration query includes month names and deterministic ordering.
The query is shorter than navigating the OLTP product hierarchy, but reduced SQL length isn’t the main benefit. The fact grain, dimension relationships, and business attributes are now part of the model instead of being reconstructed independently by every consumer.
This shape also maps naturally to a Power BI semantic model. Dimensions filter the fact through one-to-many relationships, measures aggregate from a declared grain, and reusable hierarchies can live in the dimensions.
Why I Didn’t Start with AdventureWorksDW2025
Microsoft provides AdventureWorksDW2025, and comparing this model with it would be useful. I chose to design from the OLTP source first because the decisions should follow the analytical requirements uncovered throughout the series.
Starting with the supplied warehouse would show how Microsoft modelled AdventureWorks. Building this version shows why I selected the fact grain, which source ambiguities remain, and where the model needs business input.
A later comparison could examine differences in dimensional scope, history, sales facts, currency handling, promotions, reseller modelling, and calendar design. I wouldn’t treat the supplied warehouse as a hidden answer key because a dimensional model is shaped by its reporting requirements.
Business Recommendations
Use the star schema as the reporting contract
Recurring BI reports should consume governed facts and dimensions rather than rebuild operational joins. That centralizes grain, customer type, channel, product hierarchy, and measure definitions.
Add history only where the business needs it
Customer territory, product classification, and salesperson ownership are candidates for slowly changing dimensions. The required history, effective dates, correction policy, and restatement rules need to be agreed before implementation.
Separate order-grain measures when required
Tax, freight, and order-level service measures shouldn’t be repeated across line facts. Add an order fact or a documented allocation method if reporting needs those values beside product analysis.
Design incremental loading and audit controls
The current script is a protected first-time full load. A production pipeline needs watermarks or change capture, late-arriving dimension handling, rejected-row logging, load timestamps, reconciliation history, and restart behaviour.
Validate the model with BI users
Technical reconciliation proves that the transformation preserved source values. It doesn’t prove that names, hierarchies, calendar definitions, or segmentation rules match how the business operates.
Limitations
- Current-state dimensions: Customer and product history isn’t reconstructed.
- Single source: The model doesn’t resolve identities across several operational systems.
- Full initial load: Incremental ingestion and change detection aren’t implemented.
- Line-grain focus: Order-level tax and freight are intentionally excluded.
- No returns fact: The sample analysis doesn’t model returns or cancellations as separate business processes.
- No margin measure: Product cost and profitability aren’t included.
- Limited calendar: Financial periods, holidays, and working-day logic need business definitions.
- Rowstore design: Columnstore and partitioning should be evaluated against a larger warehouse workload.
The model is intentionally small, but it is runnable, explicit about grain, and reconciled to its source. That makes it a practical foundation for semantic modelling and BI rather than only a diagram.
Next in the Series
The final article will bring the SQL portfolio project together.
I will summarise the analytical findings, modelling decisions, technical lessons, remaining limitations, and the natural progression towards Microsoft Fabric and Power BI.